Quality Overview
The Quality Overview provides a live view of all quality controls across machines and production lines. It gives quality managers and operators a quick way to monitor the status of ongoing checks without navigating into individual orders.
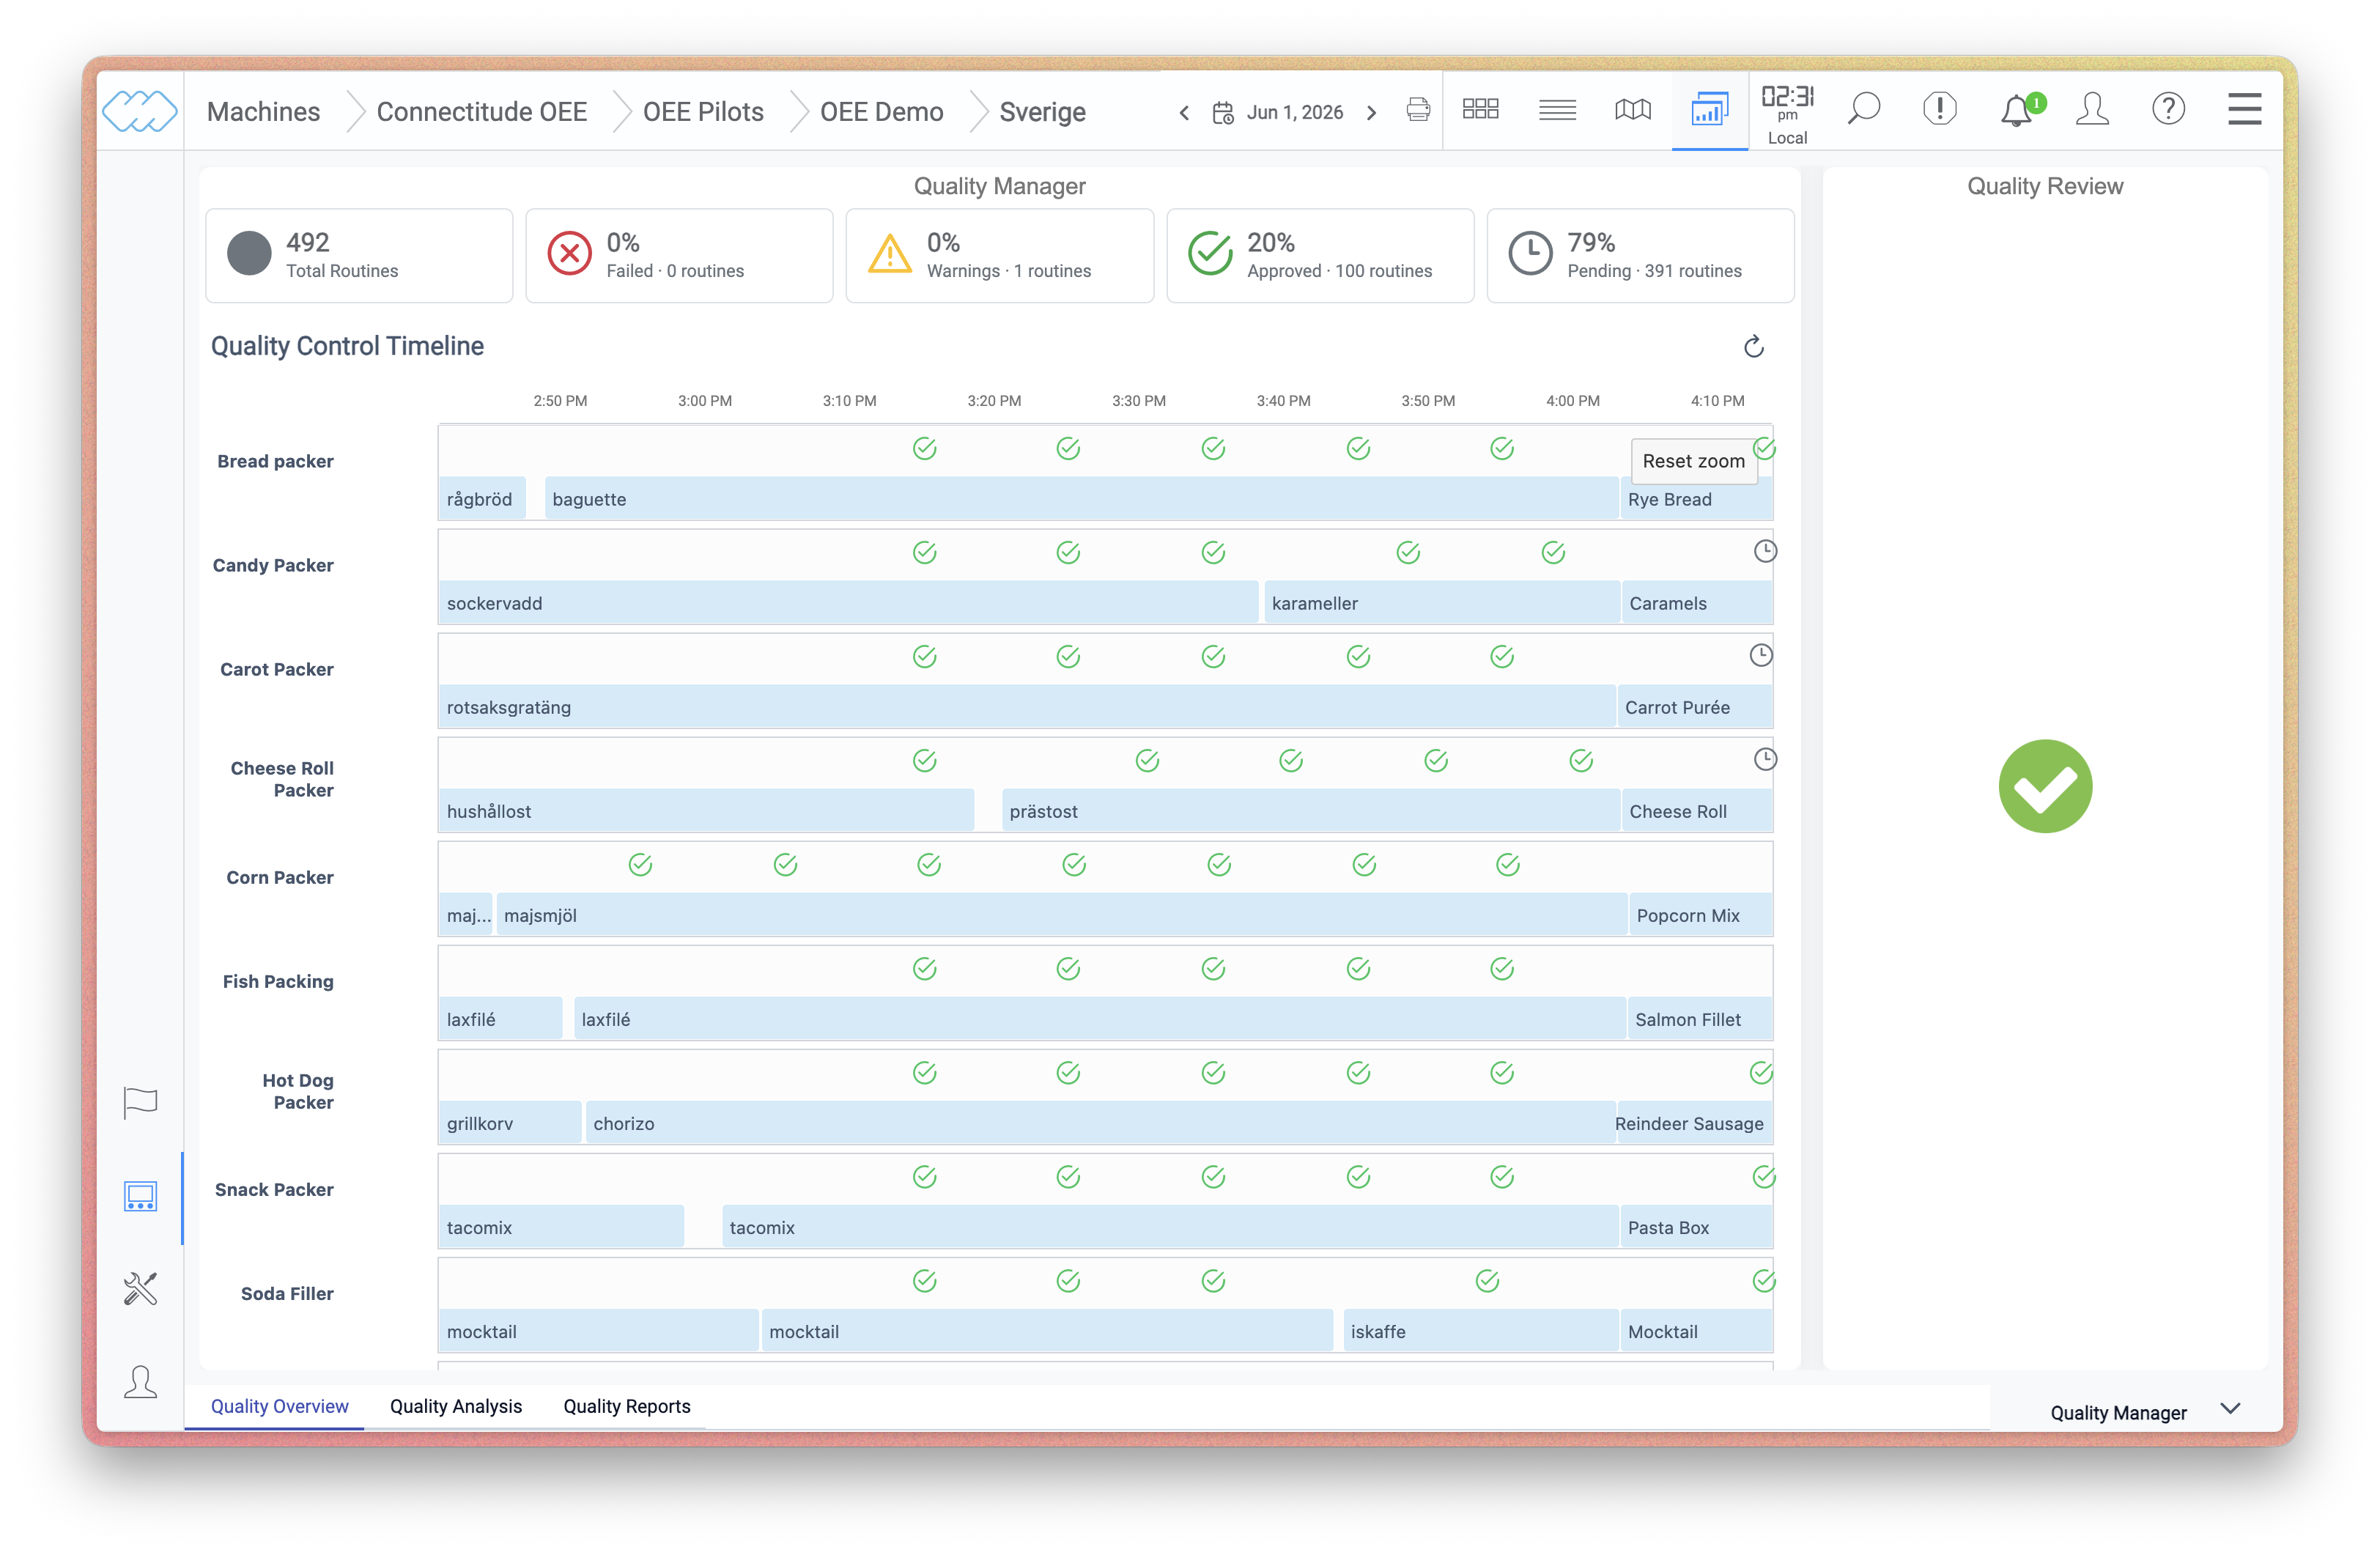
Quality Control Timeline
The timeline displays all quality controls for the selected time period, organized by machine. Each row represents a machine, and each marker on the timeline represents a completed or pending quality control. The color of the marker indicates the result:
 Green – the control was approved and all values are within limits.
 Yellow – the control has one or more warnings, meaning values are approaching a limit.
 Red – the control has one or more values that exceed a limit and was disapproved.
 Gray – the control has been triggered but not yet completed.
 Stacked – several controls fall within the same time window and are grouped into a single marker. Click to expand and view the individual controls.
Summary bar
At the top of the overview, a summary bar shows the total number of controls for the selected period, broken down by status:
- Total routines – the total number of controls.
- Failed – controls where one or more values exceeded a limit.
- Warnings – controls with values approaching a limit.
- Approved – controls completed without any deviations.
- Pending – controls that have been triggered but not yet completed.
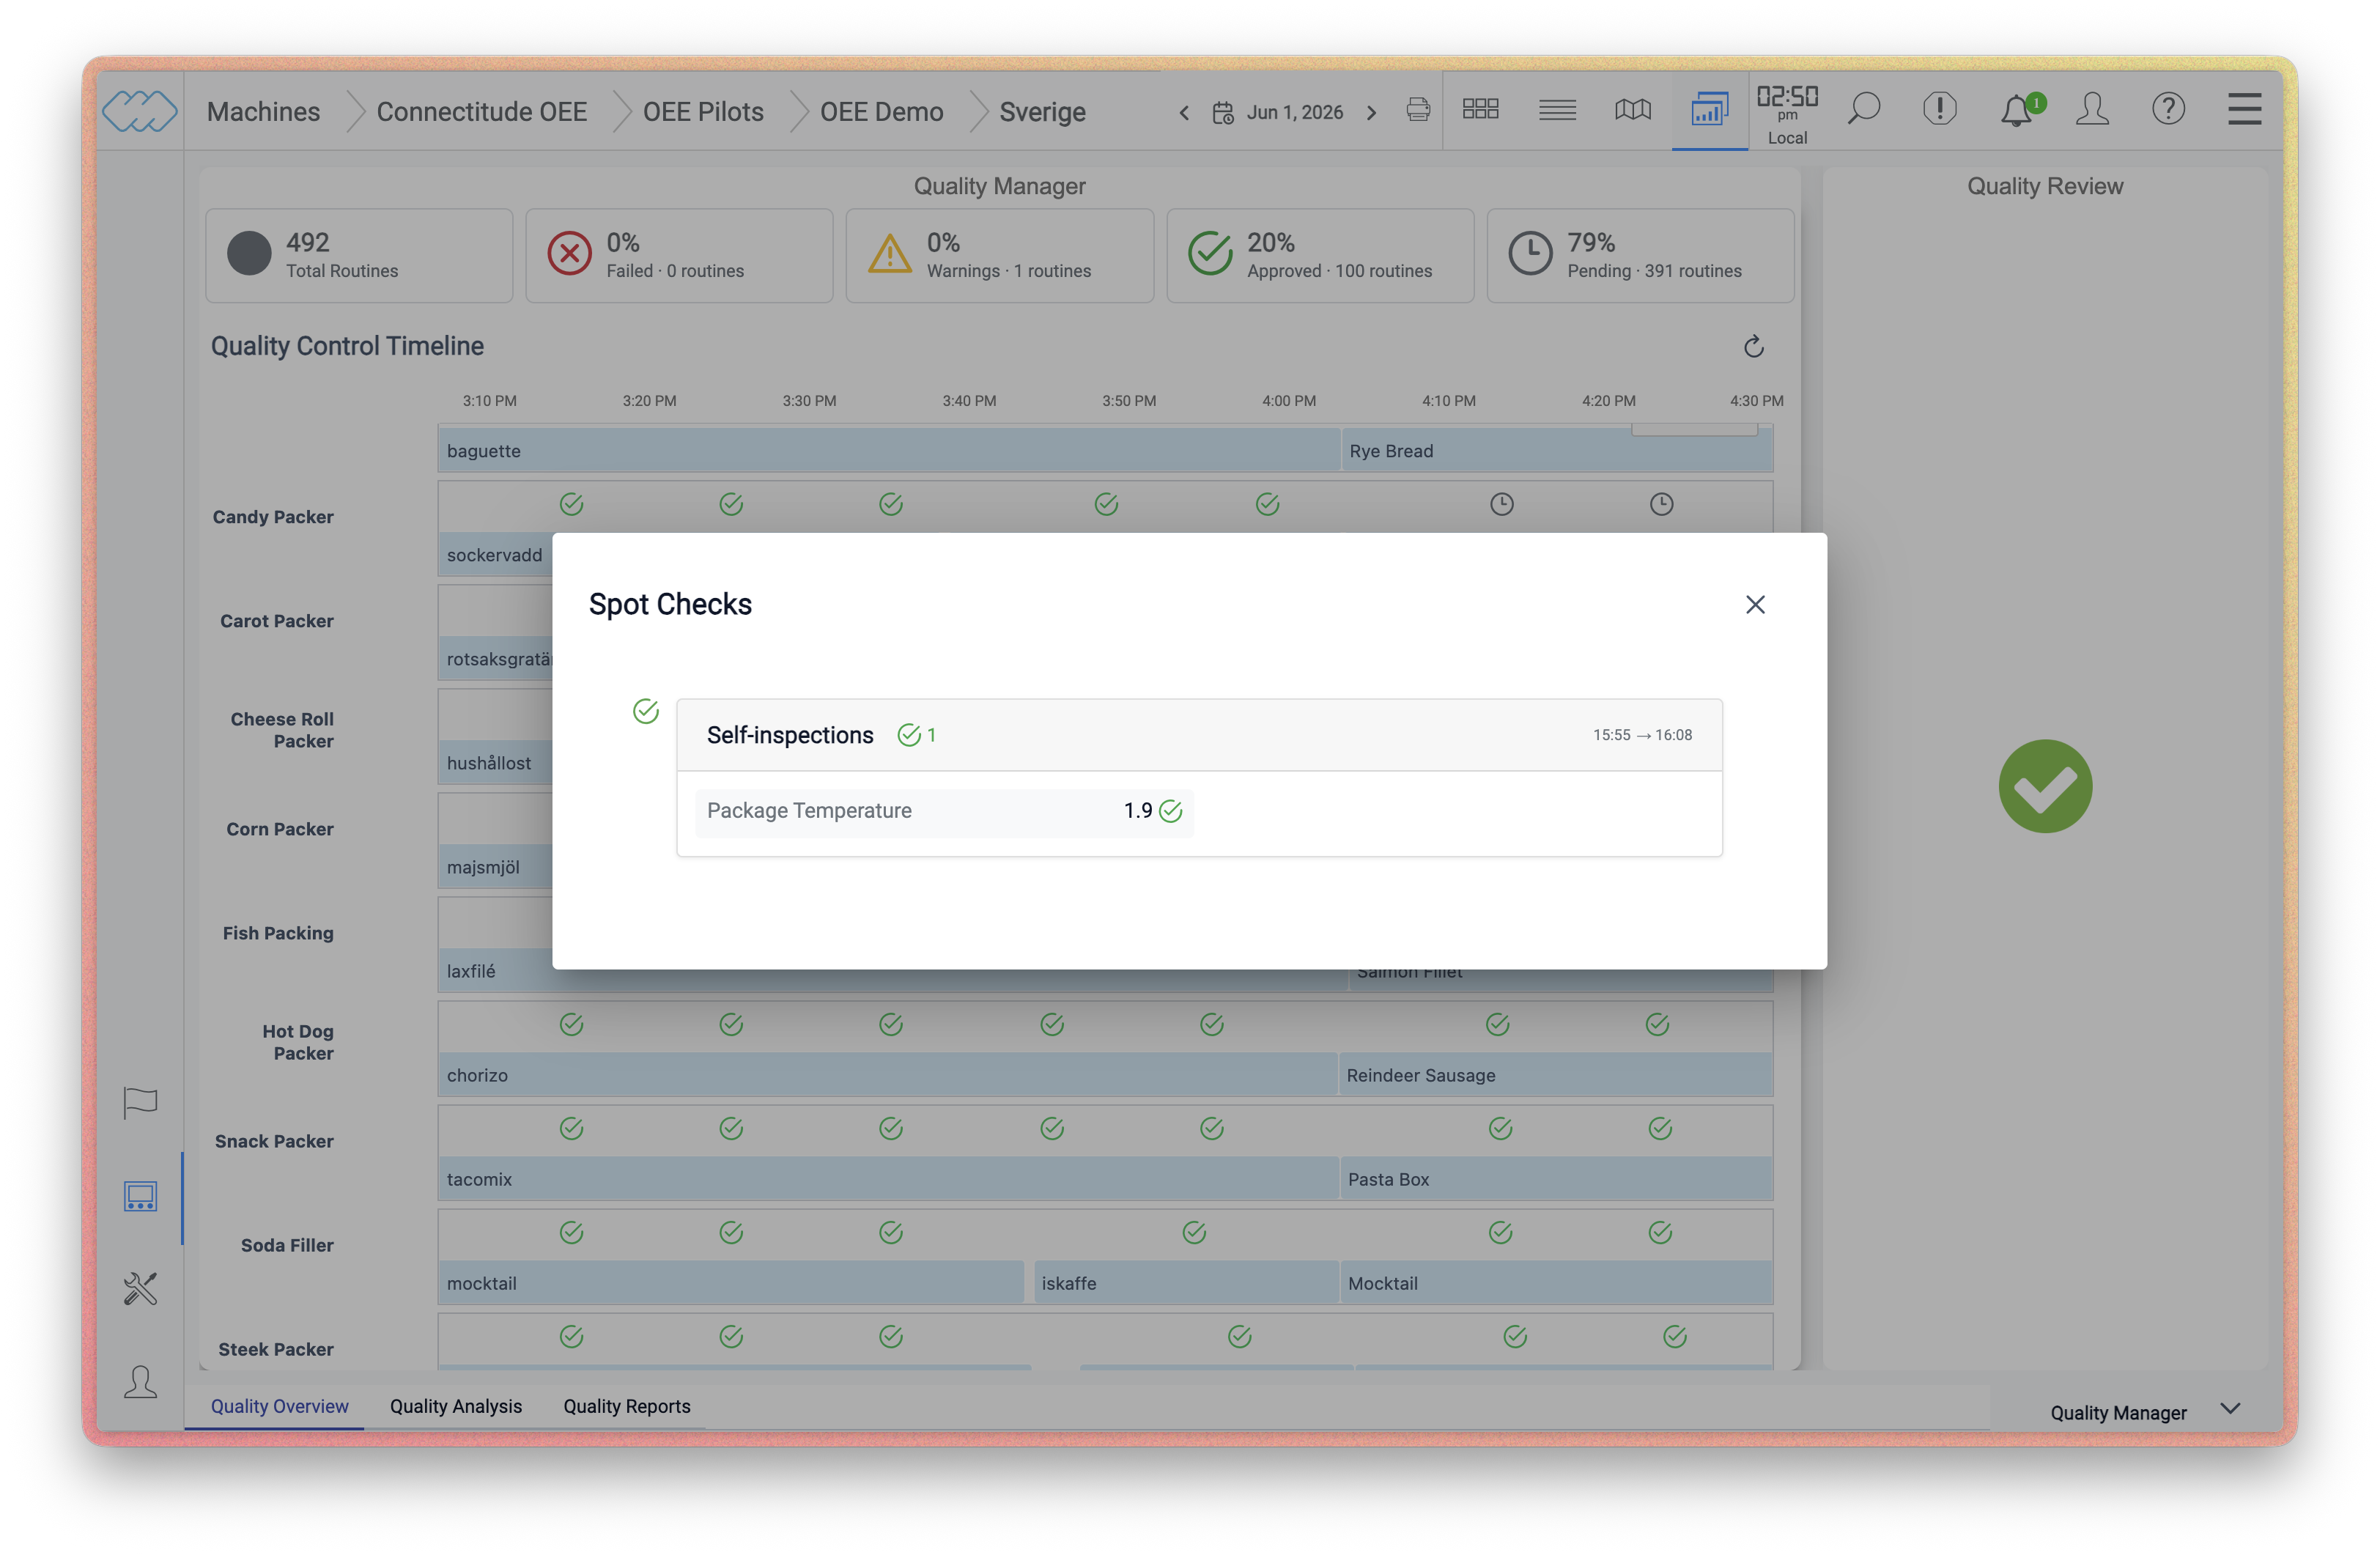
Quality Controls
Clicking a marker on the timeline opens the Quality Controls panel, which lists the individual check points for that control. Each check point shows the measured value and its result.
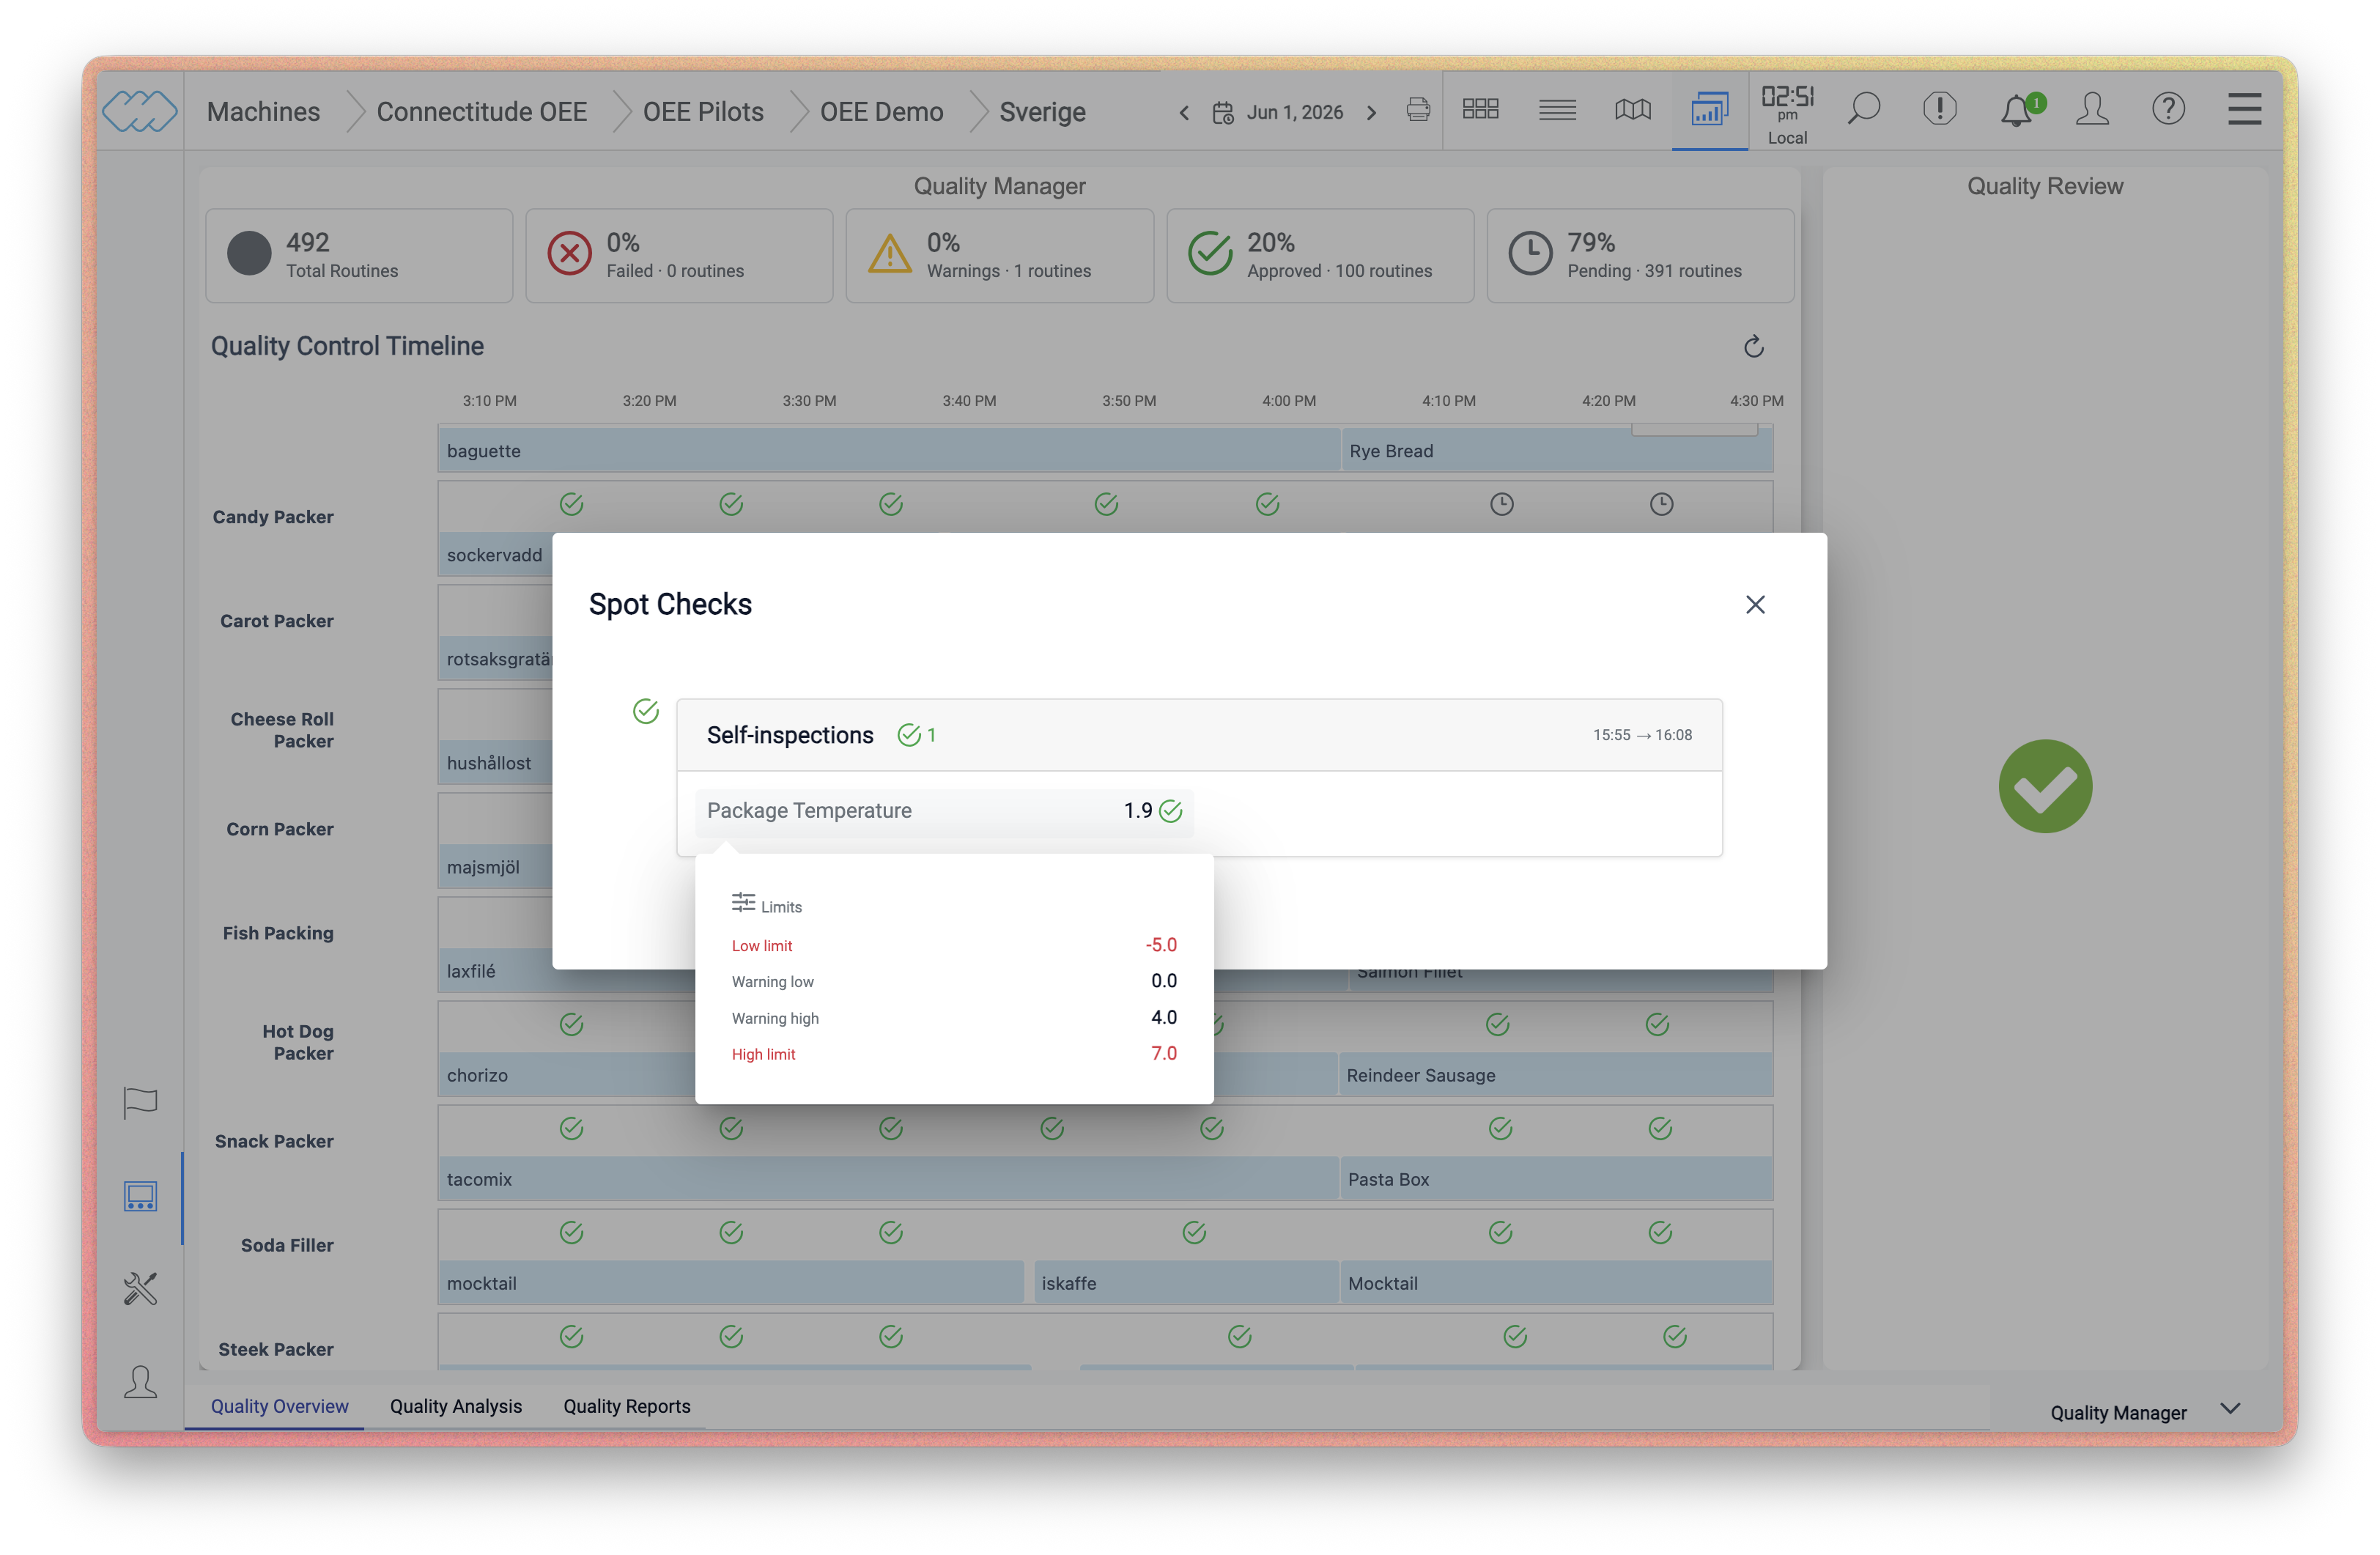
Limits
Hovering over a check point value reveals the configured limits for that control point: low limit, warning low, warning high, and high limit.
Warnings
A warning tooltip is shown when a control contains a value that is approaching a limit. The tooltip displays the date and time, the type of deviation, and the status of the self-inspection.
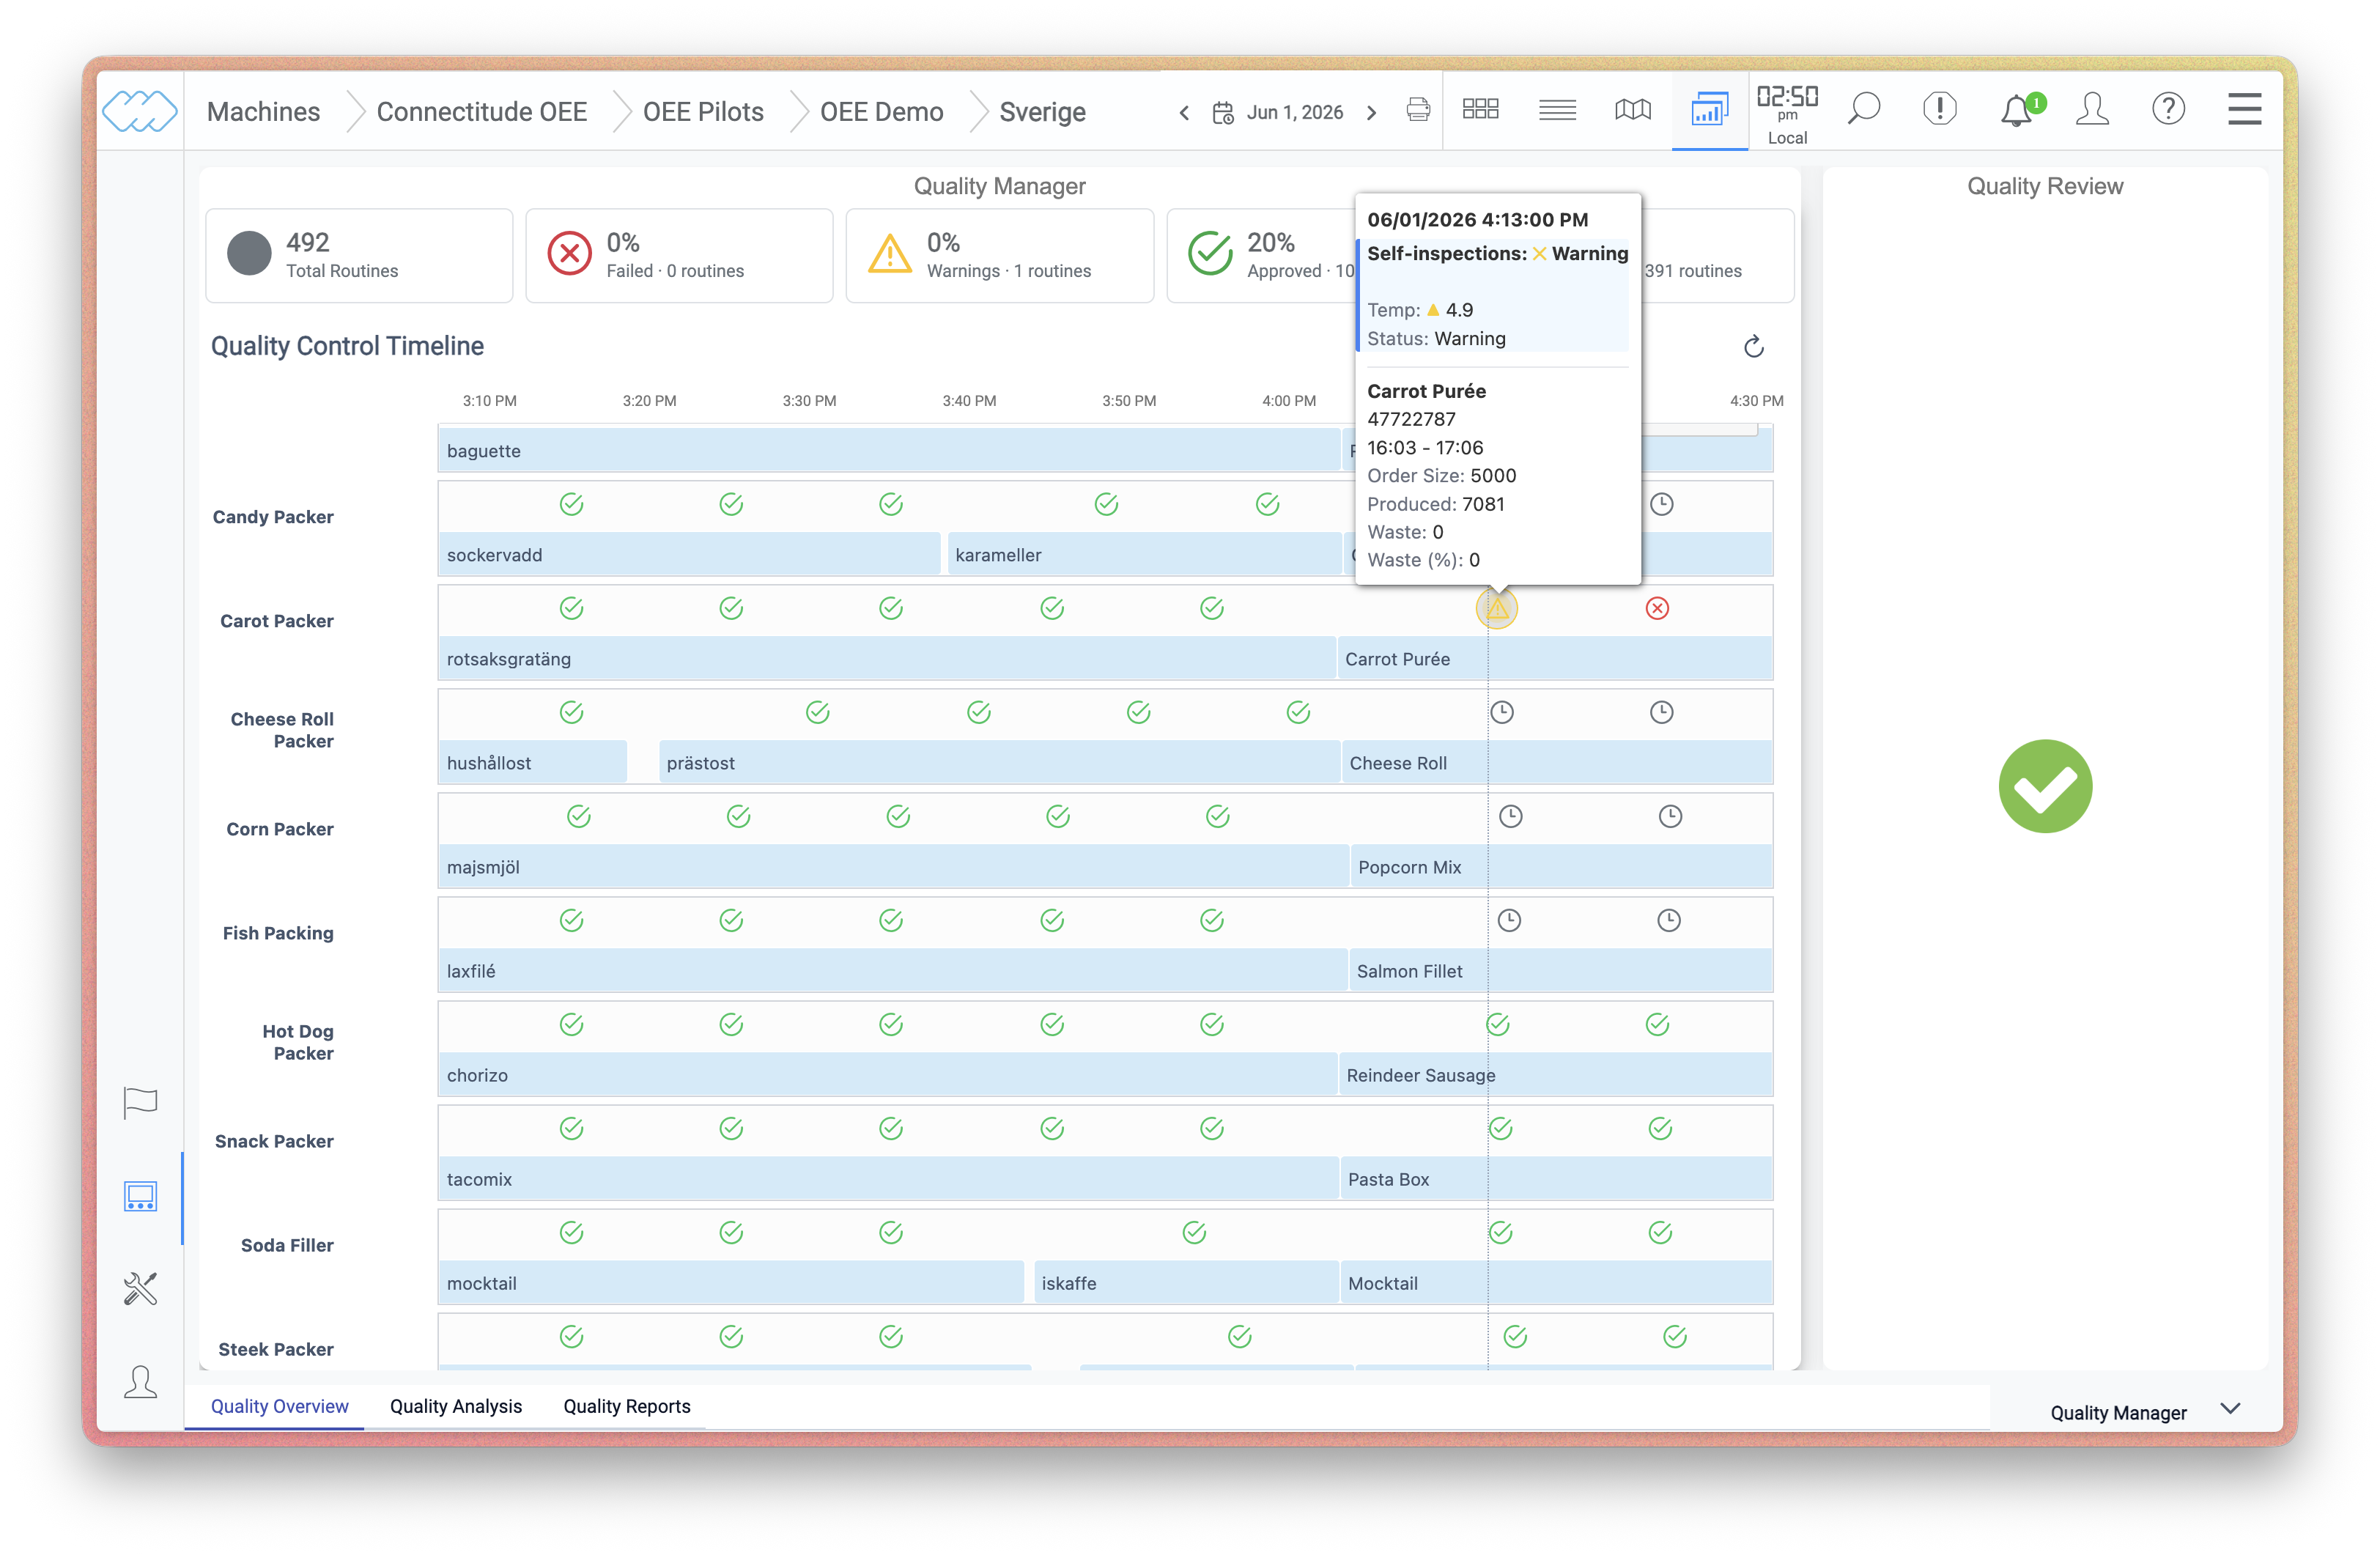
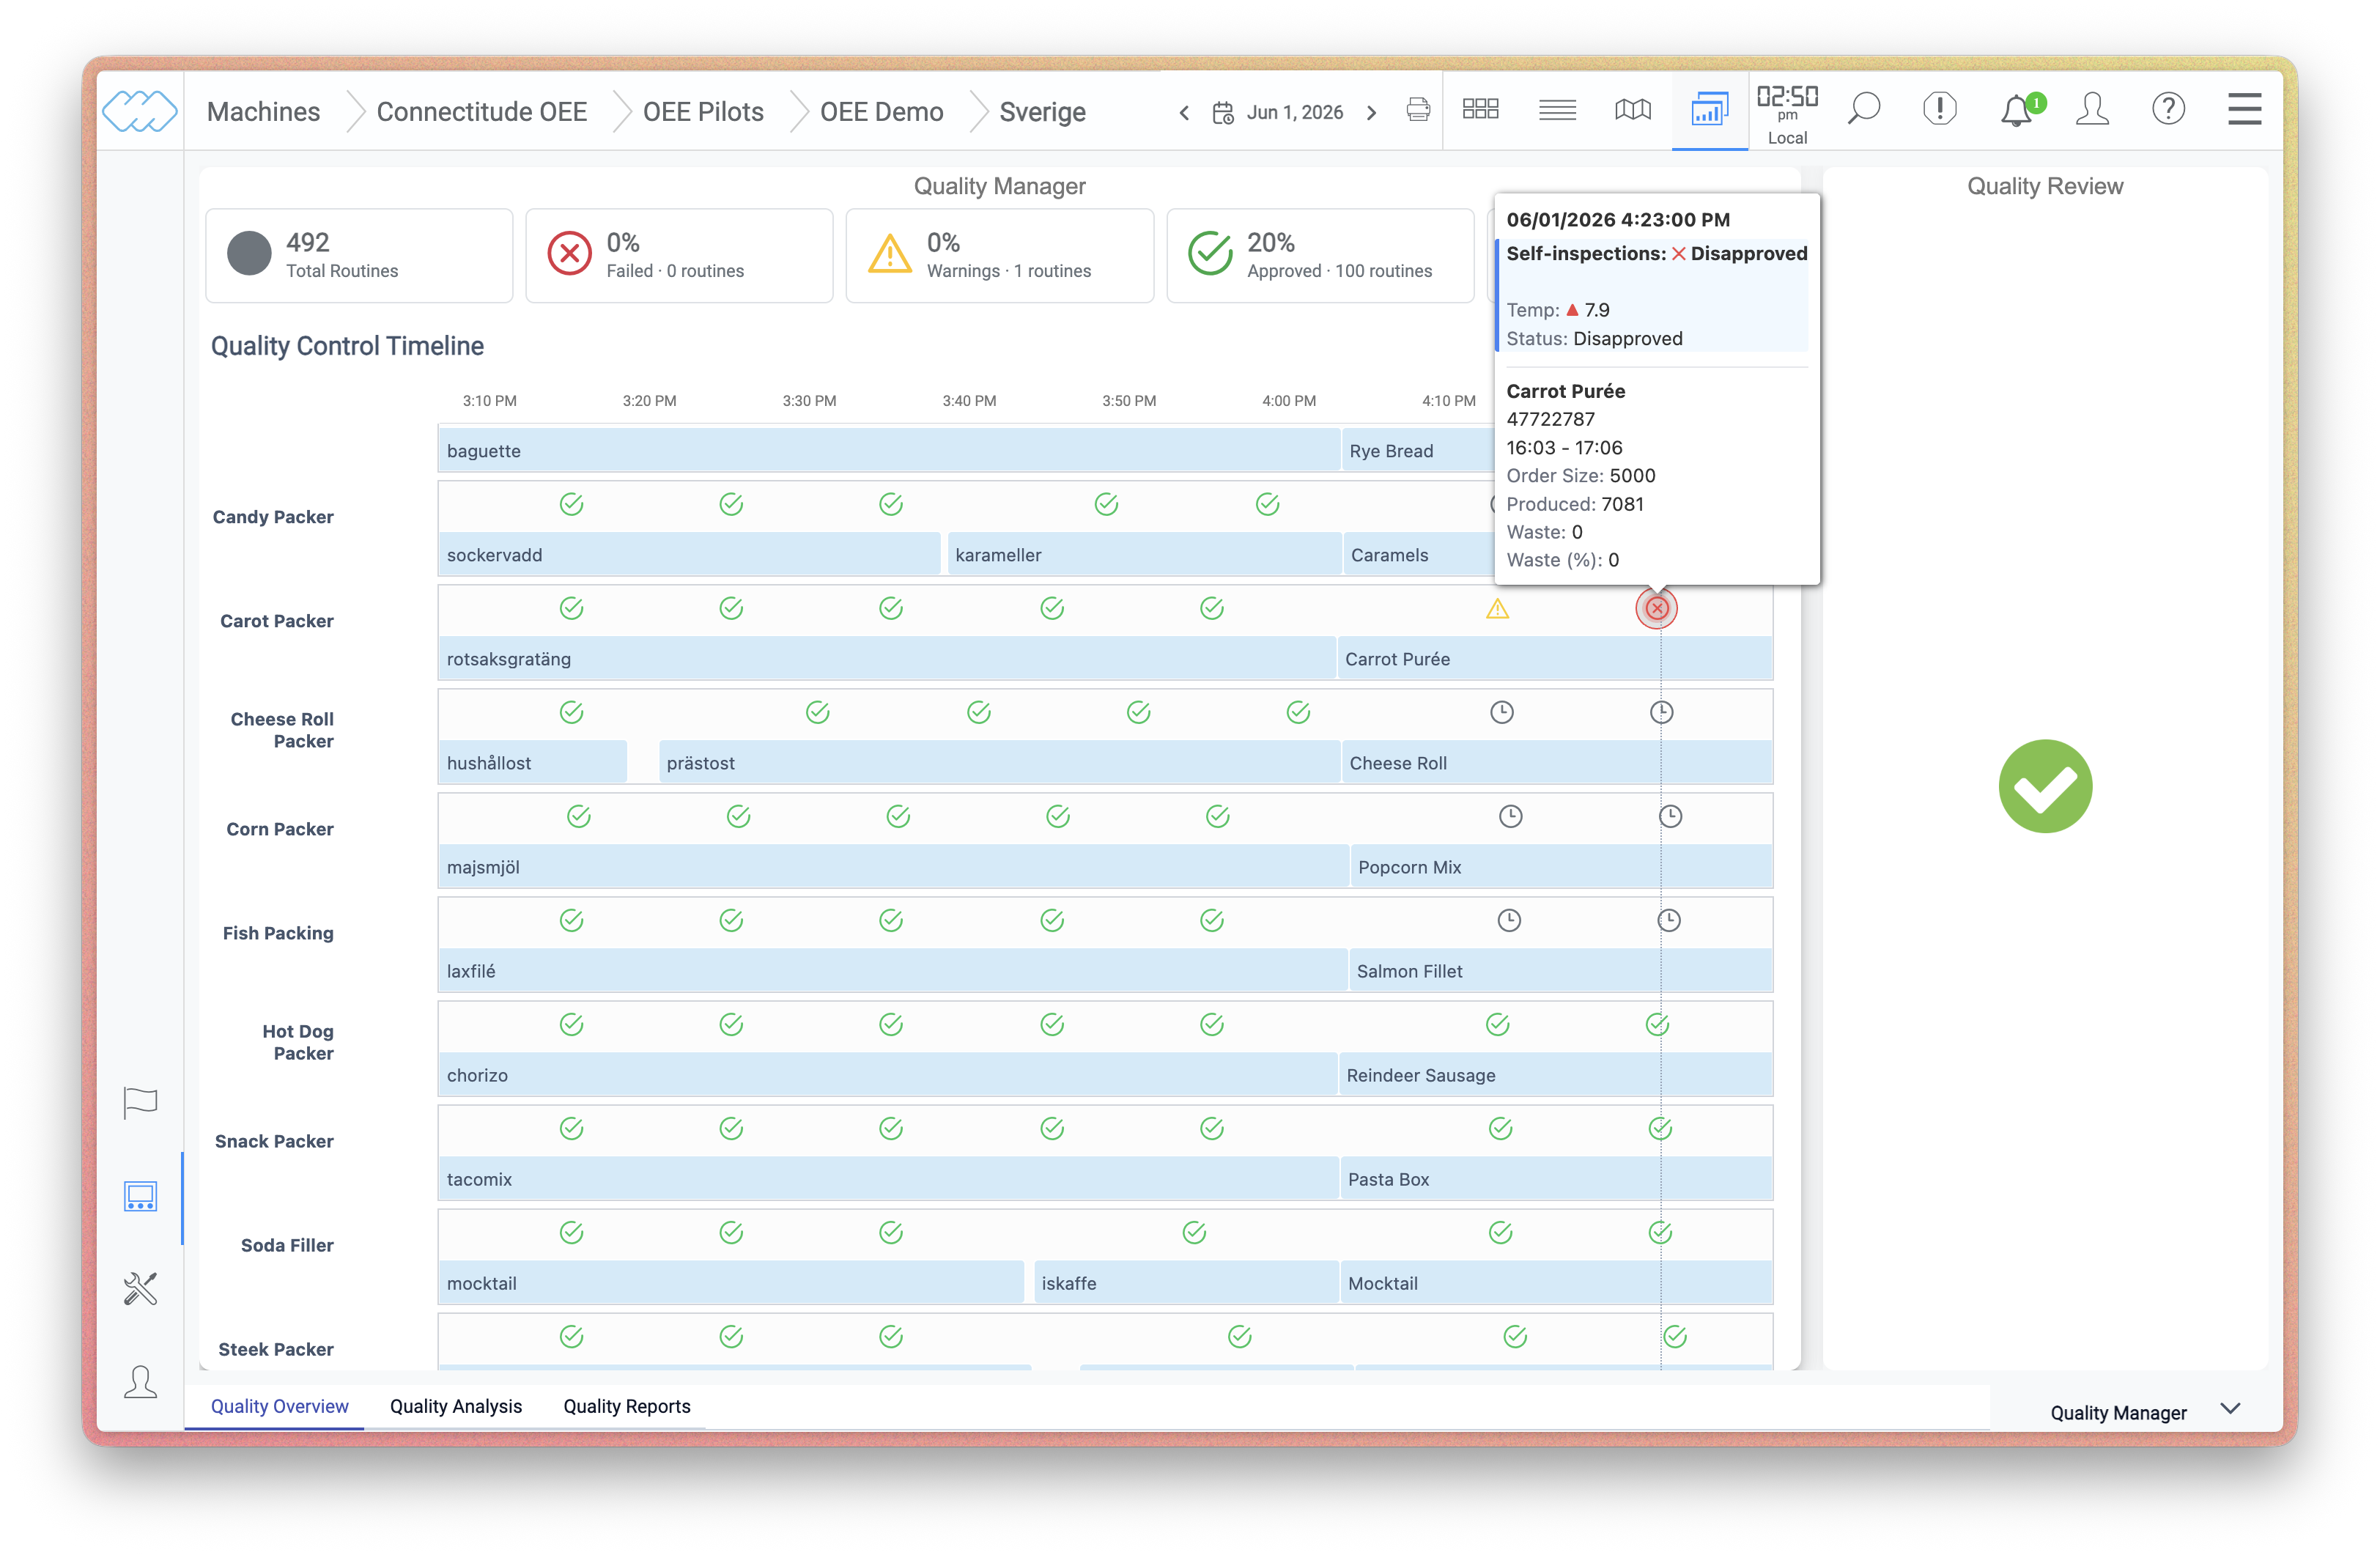
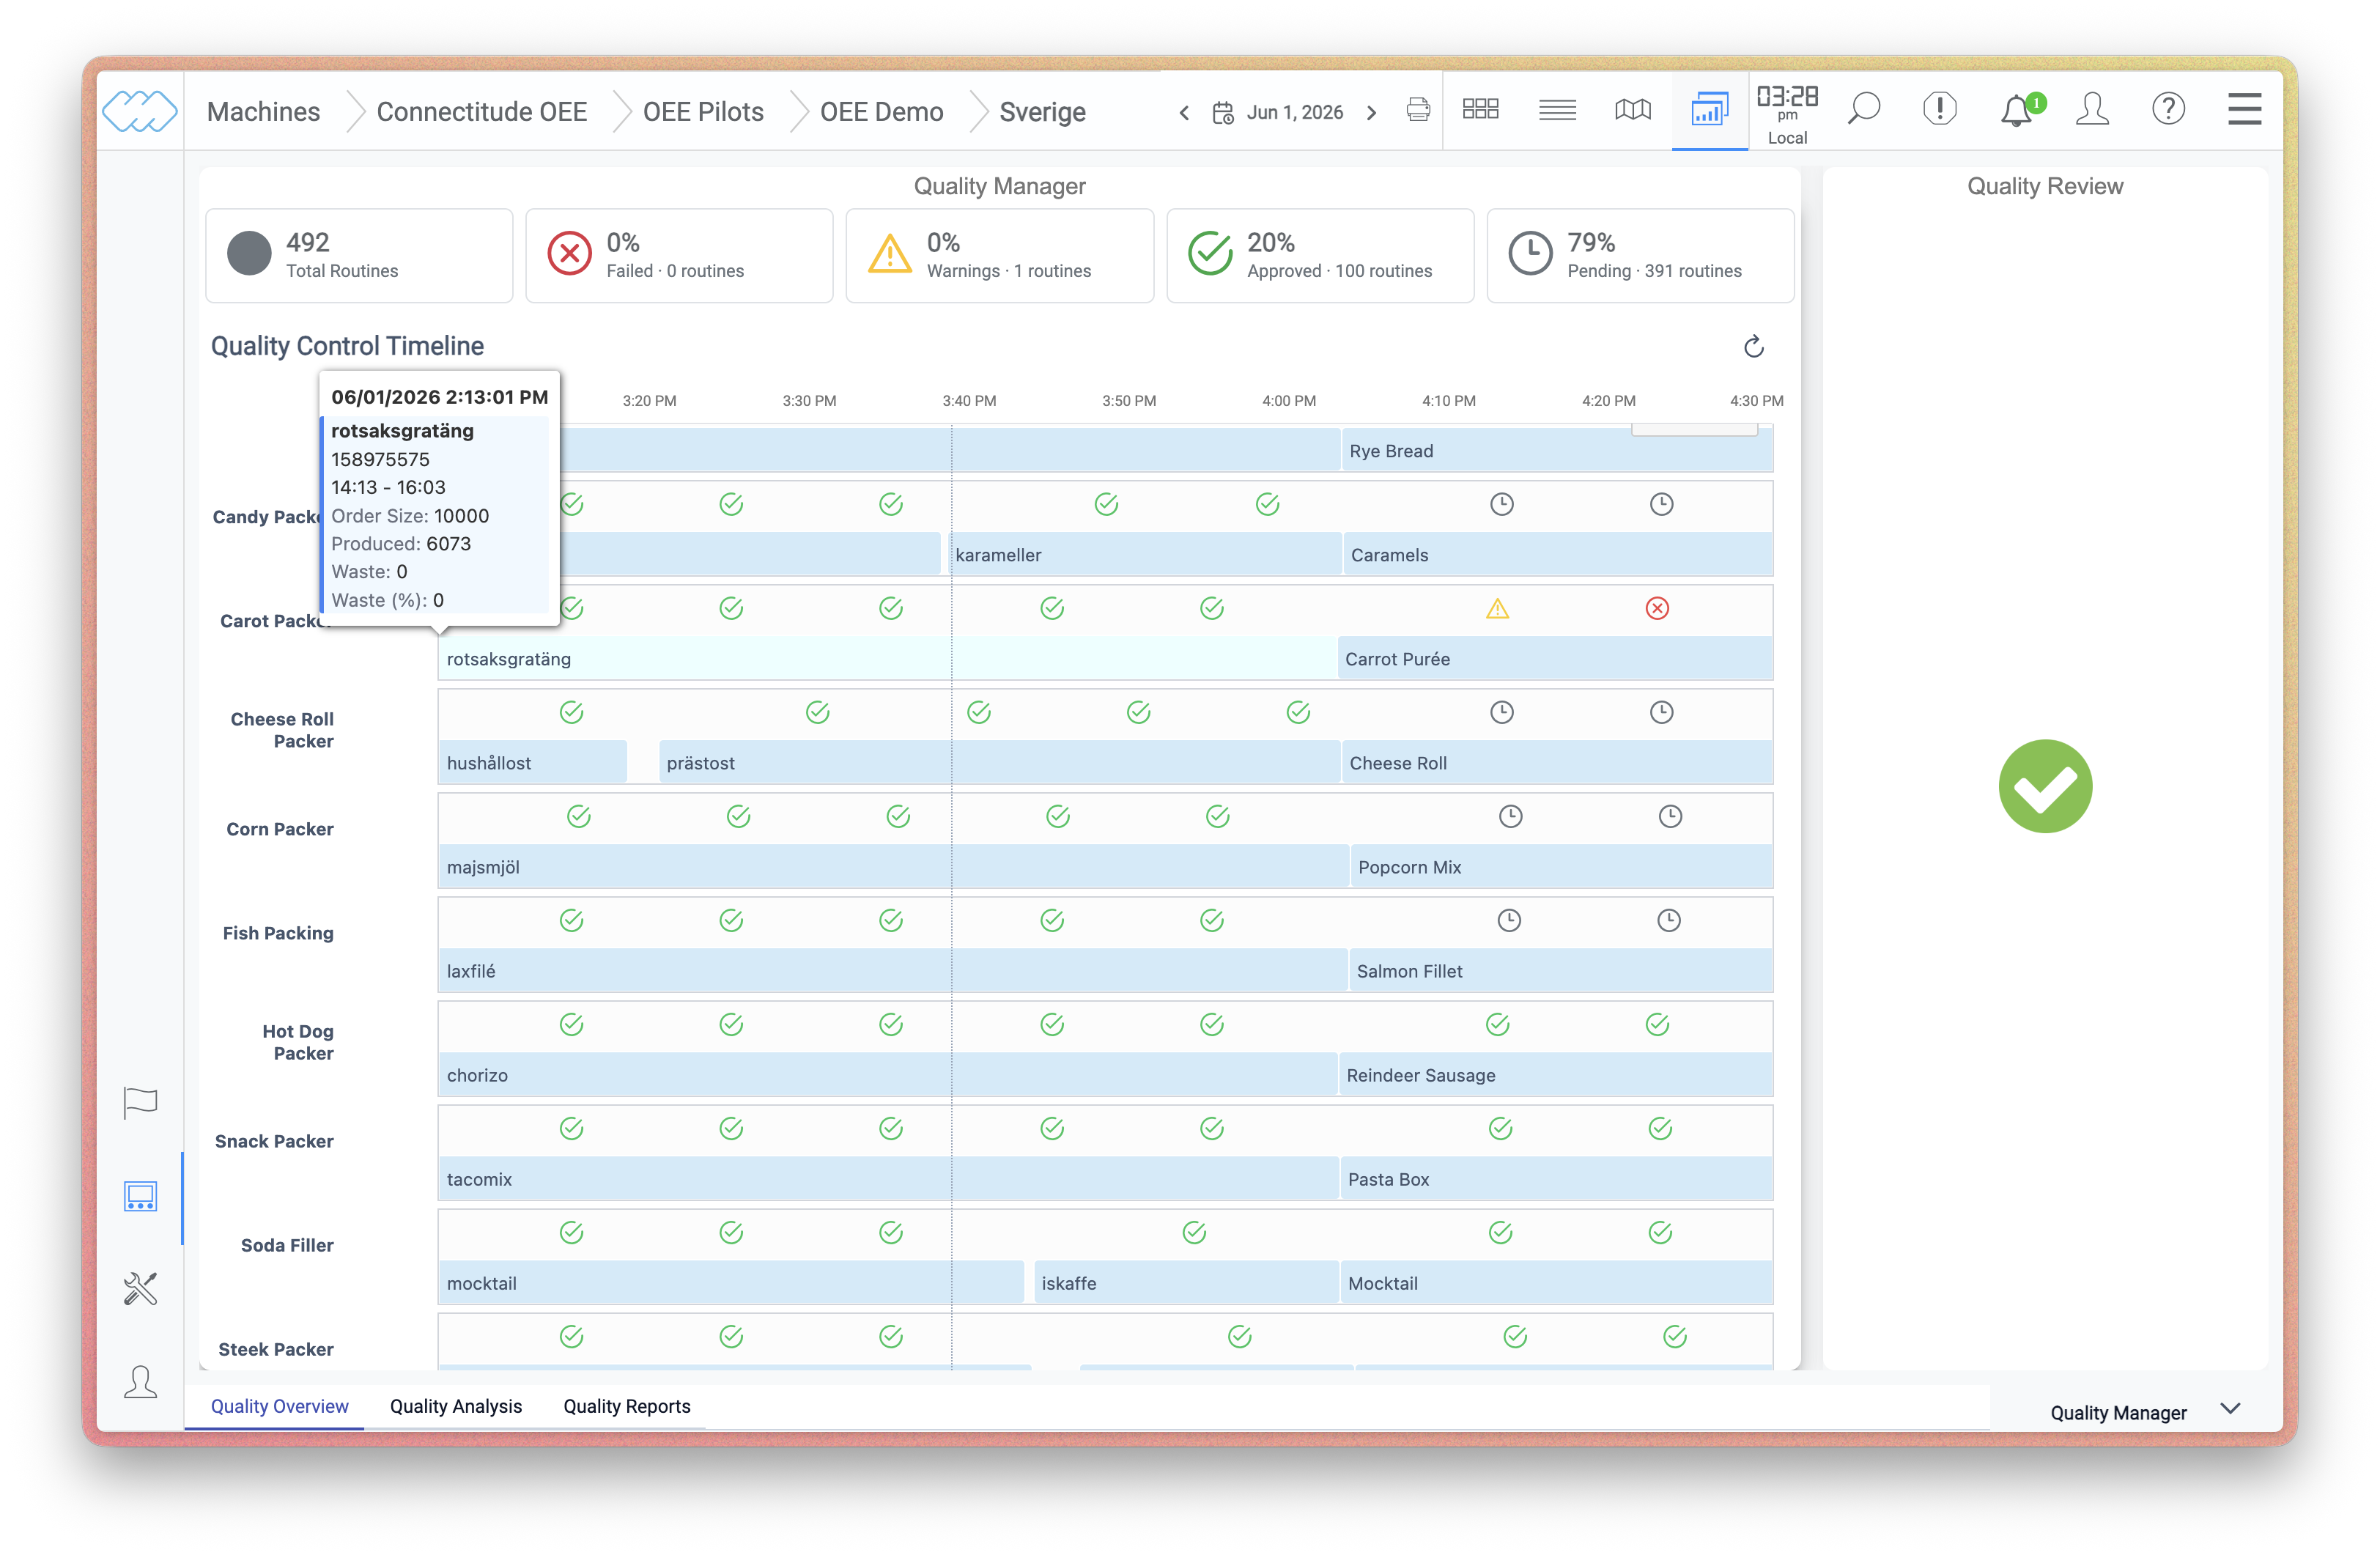
Order Information
Hovering over a marker also shows order details for the control, including the order number, time range, order size, amount produced, waste, and waste percentage.
Disapproved Controls
When a control is disapproved, the marker is highlighted in red on the timeline. The tooltip shows the same order details as for other controls, making it easy to correlate quality issues with production data.