OEE, OOE and TEEP
In Connectitude OEE the key metrics TEEP, OOE, and OEE is included to provide a structured view of production effectiveness at different levels – from the total available time down to how well production is carried out when an order is active.
Together, the three metrics show where in production the greatest potential for improvement
exists – whether it relates to shift planning, order utilization, or the production itself.
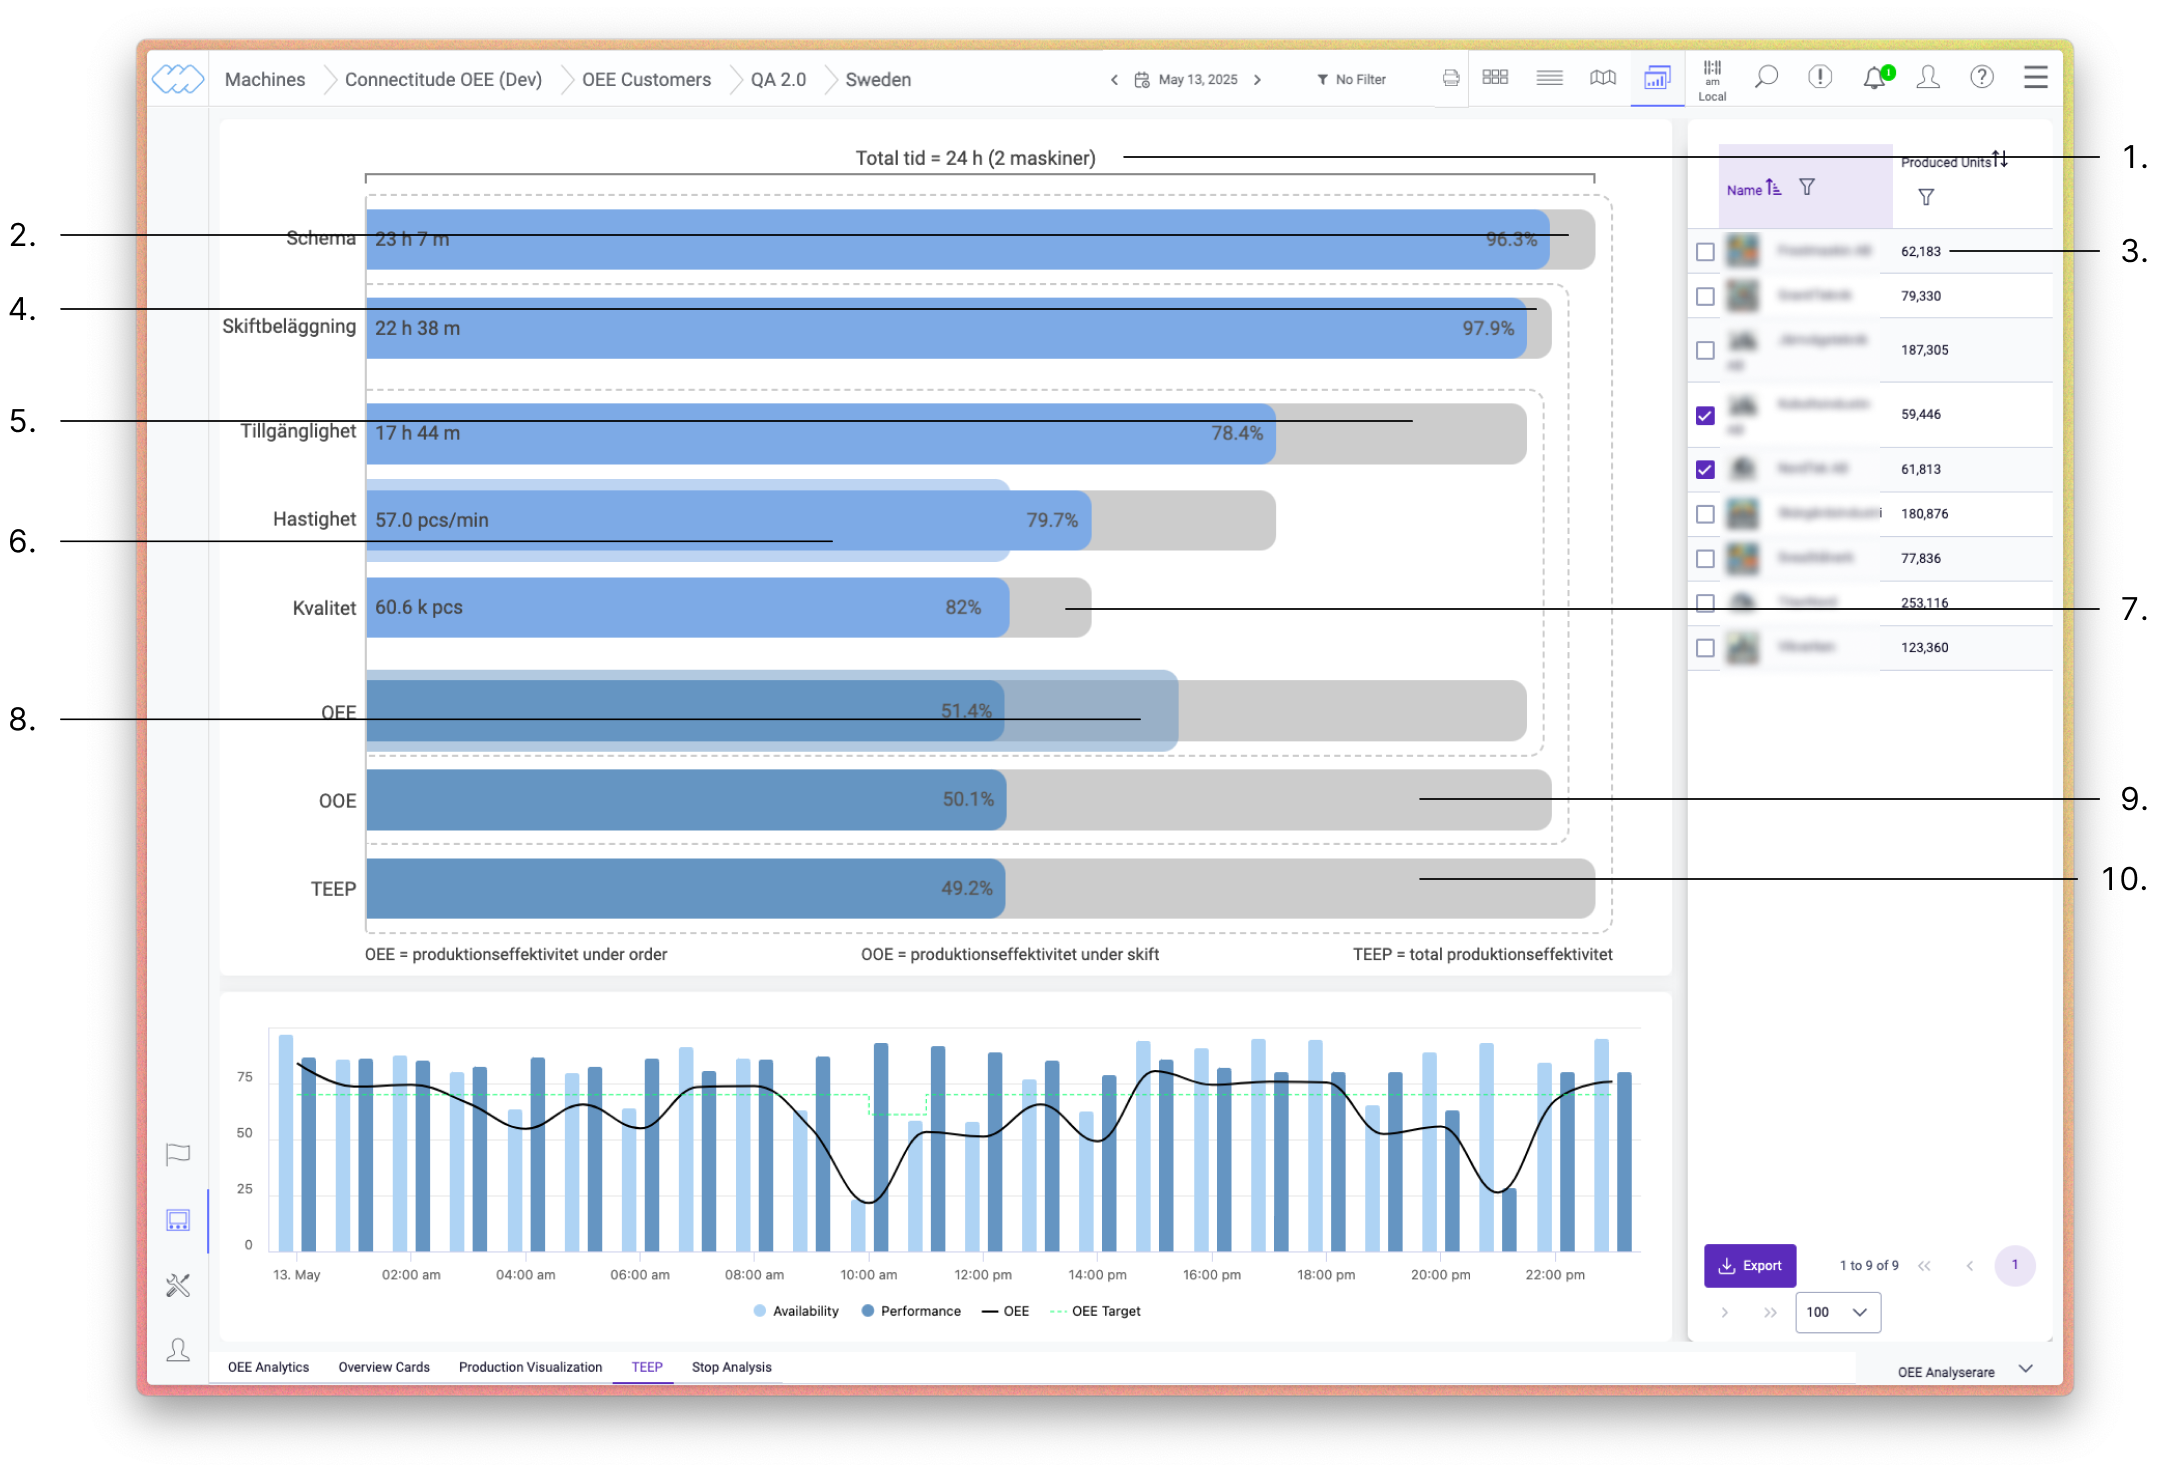
- Total calendar time and number of machines included in the report.
- Time outside scheduled shifts.
- Filter for machines or groups displayed in the dashboard.
- Time within scheduled shifts without an active order – order potential.
- Availability – registered stop time during active orders.
- Performance – the light blue shadow shows the expected performance based on planned rate.
- Quality losses during active orders.
- OEE – the light blue shadow shows the configured OEE target.
- OOE – shift potential, time within scheduled shifts without an active order.
- TEEP – total unused potential for the selected machines.
OEE – Overall Equipment Effectiveness
OEE measures how efficiently a machine is used during an active order. The metric is based on three factors:
- Availability – how much of the order time the machine is actually running, without stops.
- Performance – how close to the max speed the machine is producing.
- Quality – the proportion of approved units out of the total number produced.
OEE provides a clear measure of how well production is carried out when an order is active, but does not account for time outside of orders.
OOE – Overall Operations Effectiveness
OOE measures how well the planned shift time is utilized. Unlike OEE, OOE also includes time within a shift that does not contain an active order.
A low OOE value relative to OEE indicates that a large portion of shift time is lost without active production, for example due to changeovers, waiting times, or insufficient order planning.
TEEP – Total Effective Equipment Performance
TEEP measures how much of the total available time (24/7/365) is actually used for production. The metric includes all time that is not scheduled as a shift.
A low TEEP value relative to OOE indicates that a large part of the day has no scheduled production. TEEP is used to assess overall capacity utilization and is particularly useful for capacity planning and investment decisions.
Dashboard
The dashboard visualizes the metrics in a structured view. At the top, scheduled time is shown relative to all hours of the day. Below that, shift utilization is displayed – how much of the planned time contains active orders. Further down, availability, performance, and quality are shown, which together form the basis for OEE.
On the right, a list of the machines included in the selected view is displayed. For each machine, the amount produced during the selected time period is shown. Machines can be shown or hidden individually to customize the overview.