Process Views
Using process views you can customize the visualization of your data using many different controls. You can also transform the data in many different ways using calculations.
Creating a process view
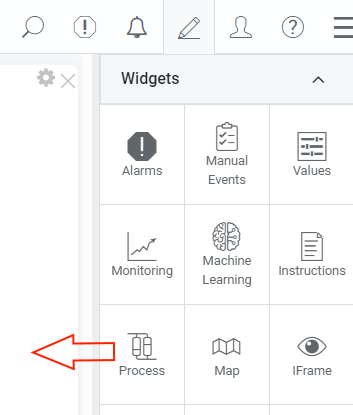
Drag a process view widget onto your dashboard:
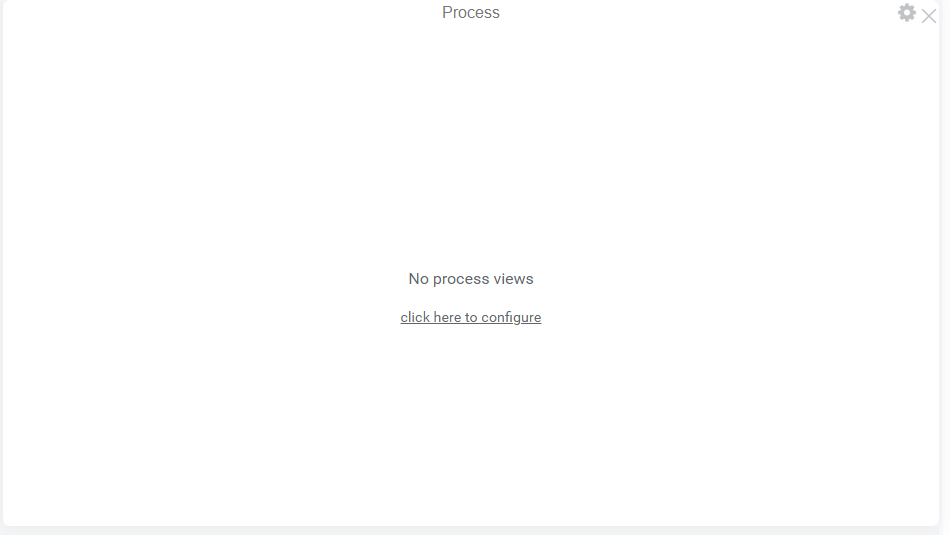
Then click the title of the widget or click the text to configure it:
Create a new view under the edit menu:
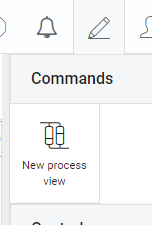
That's it, now you have created a process view. You can start visualizing data now by drag-dropping controls from the widget menu.
Visualize the latest value of a tag
Create a text control by drag and dropping one into the process view.
Select the text control and under properties click the icon next to the Text field:
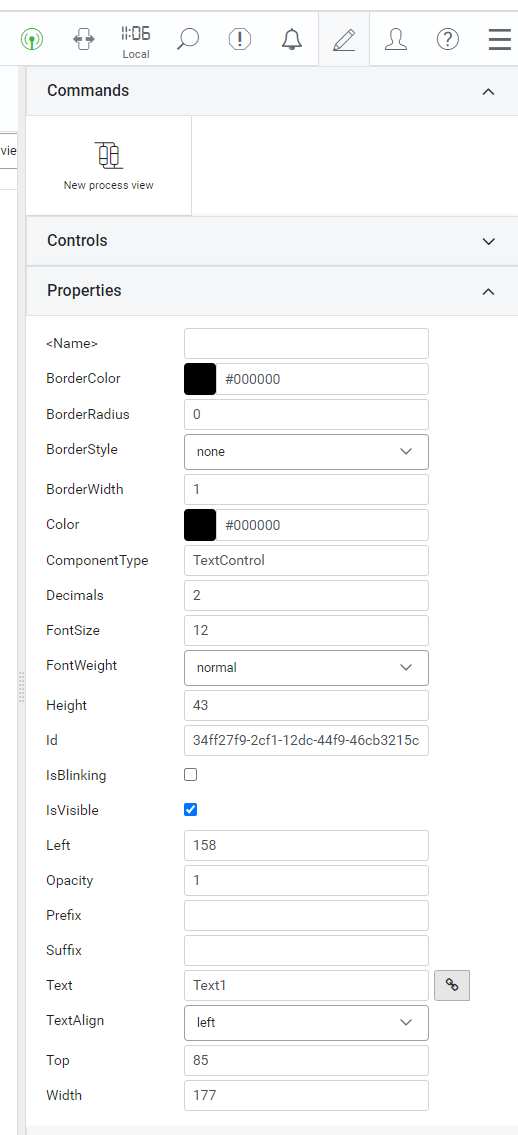
This is used to bind values to a property. So in this case we're binding a value to the text property of the text control.
You will see the following dialog:
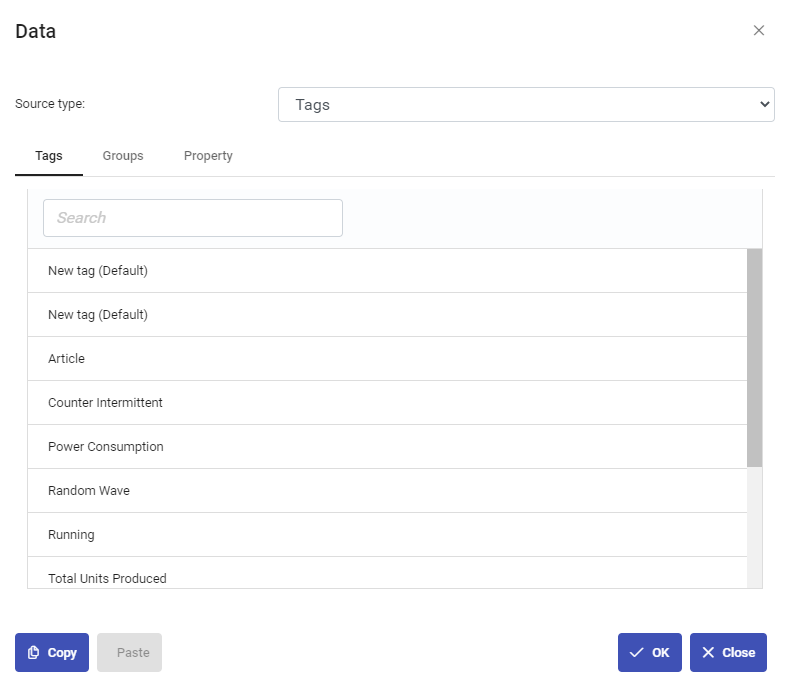
Select a tag from the tag list and close the edit menu. The process view should now display the latest value for that tag.
More advanced calculations can be performed using the data binding dialog. See the calculations section for more information.
Creating a calculation
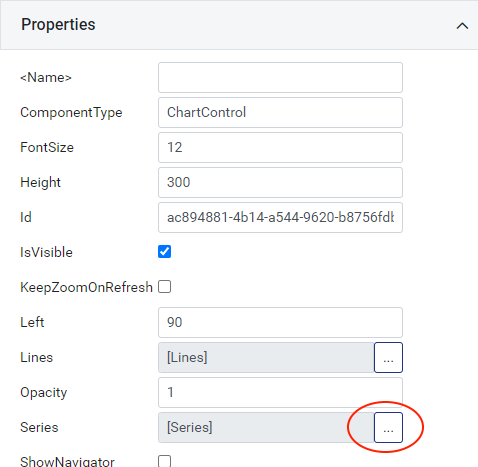
Add a chart to the process view and click the '...' button to the right of series in the properties:
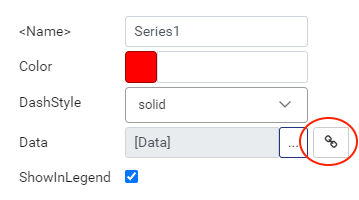
You can then add multiple series to the chart. Click the data-bind button for the data on the first series:
Select calculation under source type:
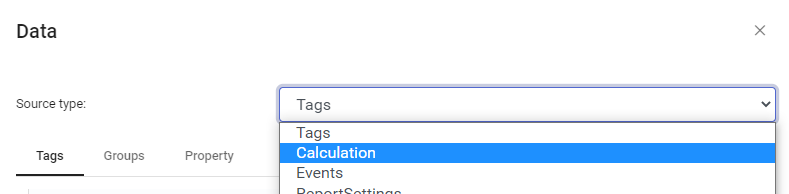
You will see the following fields:
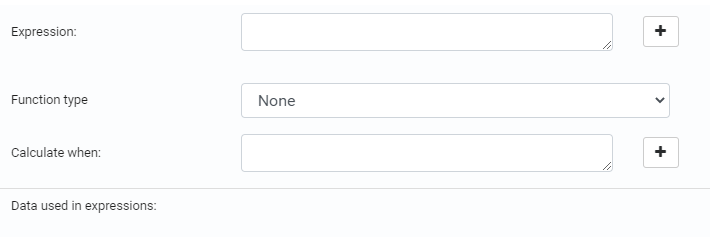
The expression field is the calculation expression.
Function type is used to apply an aggregation function to the calculation.
Calculate when is used to filter the data. For example you could select time as the function type and add an is running condition in this field to calculate the run time of your machine.
For now click the +-icon to the right of the expression field and select a tag. Then type a + character in the expression and click the '+' and select another tag. You should end up with this:
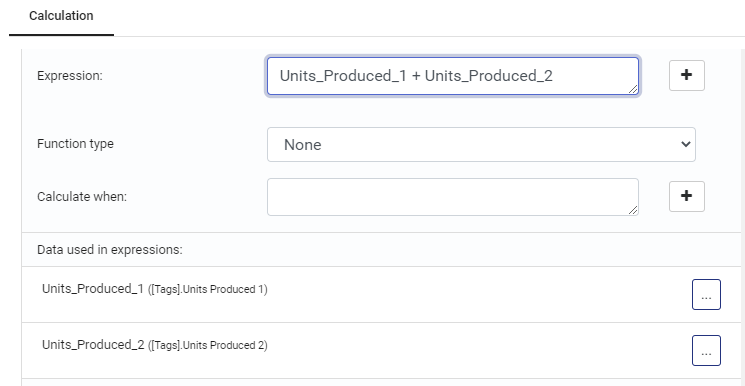
Close the dialogs by clicking OK and you should now have a chart displaying the sum of two tags in a series.
Single values compared to multiple values
Some calculations will result in a single value and some will result in multiple values (a series). This depends on the function type that is selected. It is important to keep this in mind and to select a suitable control for the value that you're visualizing.
In the example above there is no function type, so the calculation will calculate the sum of the two values every time either of the values change.
When selecting a function type, for example Maximum or Time, the result is only a single value which is not suitable to display in a chart control. Those values can be bound to for example a text control or gauge control instead.
It is also possible to apply a grouping function (for example grouping by time) so that a function can result in multiple values, one for each time group.
Examples
Machine runtime
Binding the following to a text control gives you the run time of a machine.
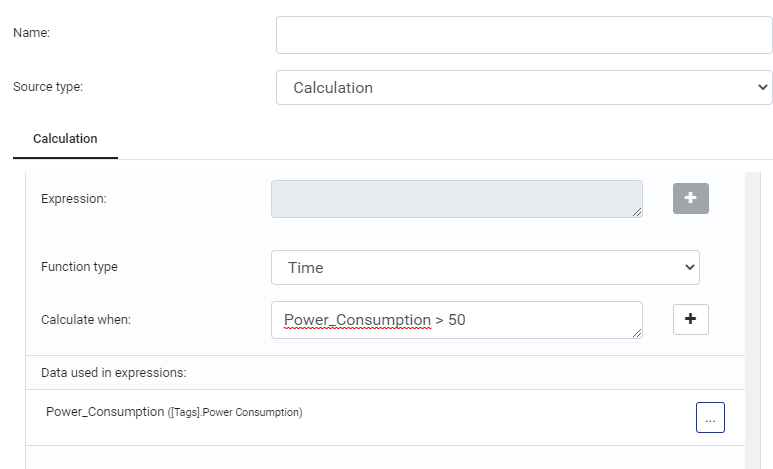
This will show you the time (in hours) that the power consumption was above 50.